
Introduction to Chart Patterns -Chart patterns indicate probabilities, not certainties
Chart patterns are distinct formations that appear on the price chart of a financially traded asset. There are many different types of chart patterns, each distinguished by a variety of unique features. When a chart pattern is confirmed, there is a high probability that a specific price movement—either upward or downward—will occur shortly. Although a chart pattern cannot predict future price movements with certainty, it can indicate a highly probable trend reversal or continuation. Chart patterns are especially useful in confirming signals provided by other technical analysis tools, such as the MACD or RSI.
📌 In this article, we will explore the most important and high-probability chart patterns. But before that, we must emphasize the importance of confirming any chart pattern to avoid false signals.
🔒 The Importance of Confirming Chart Patterns
Regardless of the timeframe, confirmation is crucial when trading based on chart patterns. Without confirmation, you increase the likelihood of trading false signals. Here are the three most important confirming indicators for traders:
✅ Breakouts must be decisive: When the price breaks through a chart pattern boundary—such as a neckline—the closing price should move significantly beyond that boundary. This indicates genuine strength.
✅ Retests enhance the significance: When the price pulls back and retests the breakout or breakdown level, it provides additional confirmation that the chart pattern is valid.
✅ Never underestimate volume: Volume should increase during a breakout or breakdown. Conversely, volume should decline during periods of consolidation within the pattern.
📋 Two General Categories of Chart Patterns (Reversal & Continuation)
There are two main categories of chart patterns: Reversal Patterns and Continuation Patterns. Reversal patterns signal the end of the current trend, while continuation patterns indicate that the price trend is likely to persist in the same direction.
📈 MAJOR REVERSAL CHART PATTERNS
(1) Head and Shoulders Patterns
- Reliability: 7/10
The Head and Shoulders pattern is widely used among traders and is considered one of the most reliable reversal patterns. The timeframe for these patterns can range from a few weeks to several months. There are two types of Head and Shoulders chart patterns: top and bottom.
(i) Head and Shoulders Top is a chart pattern that signals the end of an uptrend, as shown on the left side of the following chart.
- Success rate (≥ break-even): 81%
- Average decline: 16%
- Percentage meeting target: 51%
(ii) Head and Shoulders Bottom, also known as Inverse Head and Shoulders, is a chart pattern that signals the reversal of a downtrend, as shown on the right side of the chart below.
- Success rate (≥ break-even): 90%
- Average rise: 45%
- Percentage meeting target: 71%

(2) Double Tops and Bottoms Patterns
- Reliability: 4/10
Double tops and bottoms are common patterns in financial markets, though they are not considered highly reliable. These patterns are confirmed when a price movement tests a support or resistance level twice but fails to break through. The timeframe for these patterns typically ranges from a few weeks to several months.
(i) Double Bottom
-
Success rate (≥ break-even): 81%
-
Average rise: 43%
-
Percentage meeting target: 71%
(ii) Double Top
-
Success rate (≥ break-even): 73%
-
Average decline: 14%
-
Percentage meeting target: 45%

(3) Triple Tops and Bottoms Patterns
- Reliability: 5.5/10
Triple tops and triple bottoms are formed when the price tests a support or resistance level three consecutive times without breaking through. When these patterns occur, the resulting trend reversal is usually fast and strong. The typical timeframe ranges from a few weeks to a couple of months; however, triple tops and bottoms can also be identified over longer timeframes.
(i) Triple Top
- Success rate (≥ break-even): 75%
- Average decline: 14%
- Percentage meeting target: 49%
(ii) Triple Bottom
- Success rate (≥ break-even): 86%
- Average rise: 44%
- Percentage meeting price target: 72%

(4) Rounding Top and Bottom Patterns
- Reliability: 8.5/10
Rounding top and bottom patterns, also known as Saucer patterns, are very reliable chart patterns. They indicate a significant reversal of an uptrend or downtrend following a long consolidation period. The timeframe typically spans several months to several years.
In many cases, rounding tops and bottoms can be explained by the Wyckoff accumulation/distribution model. 🔗 More: » The Wyckoff Method
(i) Rounding Top
- Success rate (≥ break-even): 87%
- Average decline: 19%
- Percentage meeting target: 13%
(i) Rounding Bottom
- Success rate (≥ break-even): 97%
- Average rise: 58%
- Percentage meeting target: 64%


📉 MAJOR CONTINUATION CHART PATTERNS
(5) Cup and Handle Patterns
- Reliability: 9/10
The Cup and Handle is a continuation chart pattern indicating that an uptrend has paused but will not reverse. The pattern is named because it resembles the shape of a cup. When a Cup and Handle pattern is confirmed, the uptrend strengthens. This pattern can be identified across a wide range of timeframes, from a few months to a couple of years. There is also an inverted Cup and Handle pattern, which signals the continuation of a downtrend. Both the bullish and bearish Cup and Handle patterns are considered extremely reliable.
Cup and Handle (bullish continuation)
- Success rate (≥ break-even): 95%
- Average rise: 52%
- Percentage price target: 62%
Inverted Cup and Handle (bearish continuation)
- Success rate (≥ break-even): 83%
- Average decline: 17%
- Percentage price target: 62%

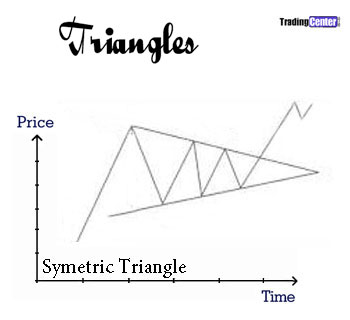
(6) Triangles Chart Patterns
- Reliability: 6/10
Triangles are common patterns in financial trading. There are three major types: Symmetrical, ascending, and descending triangles. The timeframe for these patterns typically ranges from a few weeks to several months.
Ascending Triangle (bullish trend)
- Success rate (≥ break-even): 83%
- Average rise: 43%
- Percentage meeting price target: 70%
Descending Triangle (bearish trend)
- Success rate (≥ break-even): 87%
- Average decline: 15%
- Percentage meeting price target: 50%
Symmetrical Triangle (bullish breakout)
- Success rate (≥ break-even): 75%
- Average rise: 34%
- Percentage meeting price target: 58%
Symmetrical Triangle (bearish breakout)
- Success rate (≥ break-even): 63%
- Average decline: 12%
- Percentage meeting price target: 36%
(7) Flag and Pennant Patterns
- Reliability: 5/10
Flags and Pennants are continuation patterns that signal the resumption of a trend following a sharp advance or decline. Confirmation of these patterns requires a significant increase in volume activity. The timeframe for Flag and Pennant patterns typically ranges from a few weeks to a couple of months.


![]() Conclusions and Key Points When Trading with Chart Patterns
Conclusions and Key Points When Trading with Chart Patterns
Chart patterns provide valuable insight into high-probability market movements by forecasting sharp changes in supply and demand. However, their reliability depends largely on proper recognition and confirmation, especially during price breakouts or breakdowns. It is important to remember that chart patterns indicate probabilities, not certainties.
Here are some key points regarding the use of chart patterns:
✅ Spot Patterns on High Timeframes (Daily and Higher)
Chart patterns can be identified on the charts of any financial asset—whether currency pairs, stocks/indexes, commodities, crypto, or bonds—and in any timeframe. Generally, patterns on higher timeframes (Daily, Weekly, Monthly) are more reliable than those on lower timeframes.
✅ The Importance of Confirming Chart Patterns
Regardless of the timeframe, confirmation is crucial when trading based on chart patterns. Without it, you increase the risk of trading false signals. For example, the strength of a breakout and/or a retest can enhance the significance of any pattern.
✅ Volume is Key to Validating Any Pattern in Any Timeframe
The most important factor in validating any pattern is trading volume. At critical levels, such as when the price approaches a breakout, volume should increase significantly. If volume remains unchanged or declines at these points, there is a high probability of a false pattern and a classic bear or bull trap.
✅ Chart Patterns Should Not Be Used in Isolation
Chart patterns are useful for confirming trend continuation or reversal. However, they cannot predict future price movements with certainty. Certainty is nearly impossible in financial markets, especially for experienced traders. Chart patterns should never be used in isolation; instead, they work best when combined with other tools such as MACD, Support/Resistance, Fibonacci Retracement, and more. 🔗 Read about Fibonacci Primes: » Trading with Fibonacci Primes
Sources:
- Probabilities for all the above charts patterns by Thomas Bulkowski: https://thepatternsite.com
■ Chart Patterns & Probabilities
by George Protonotarios for TradingCenter (c)
You are not allowed to publish, reproduce, translate, merge, sell, rent, or distribute any content on this website (TradingCenter). You are not also allowed to create a derivative work or utilize framing techniques to enclose any content on this website (TradingCenter).
L MORE ON TECHNICAL ANALYSIS • COMPARE • TECHNICAL ANALYSIS • INDICATORS • CYCLICAL ANALYSIS • LEARNING
□ Forex Brokers Comparison
□ Expert Advisors (EAs)
□ Broker Reviews
□ Learning
» Technical Analysis Guide
» Trading Chart Patterns
» Naked Charts & Price Zones
» Forex Technical Analysis
» Fibonacci Primes Sequence
» Harmonic Price Patterns
» RSI Precision
» PriceMomentum Chart
» CVD Indicator
» Key Technical Indicators
» ΔMP and Σ(ΔMP) Indicators
» Wyckoff Method
» TD Sequential
» Hurst Nominal Cyclical Model
» Elliott Wave Principle
» Forex Pairs
» Trading Books
» Trading Tips
