 NASDAQ PATTERN & FORECAST USING HISTORICAL DATA
Nasdaq is certainly one of the most popular and most active stock markets in the world. In this analysis we, are going to investigate the course of Nasdaq Composite Index since 1971 using TCI analysis and we are going to focus on the three bull markets of the past 20 years. Our goal is to determine the duration of the current Nasdaq bull market that started in 2009.
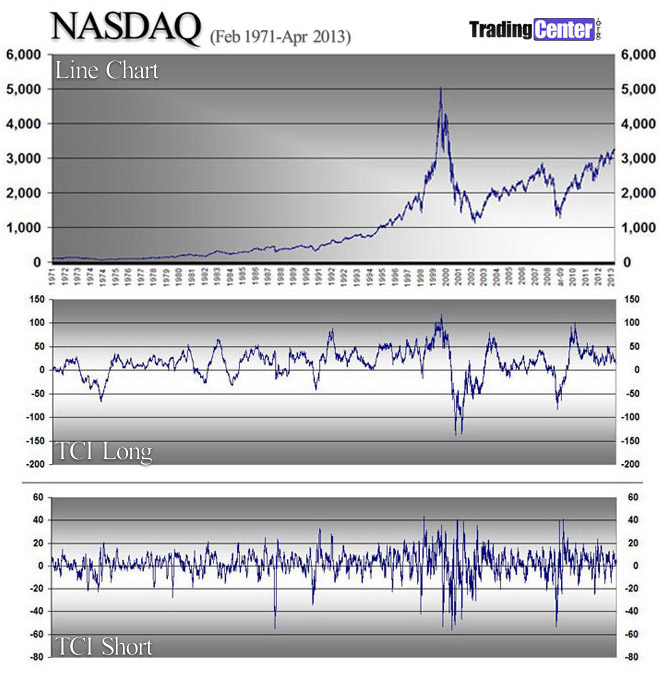
Nasdaq Line & TCI Charts (1971-2013)
The following multi-chart consist of three individual charts:
1) Line Chart on Nasdaq Closings since 1971 (1st in a row chart)
2) TCI Long Chart since 1971 (2nd in a row)
3) TCI Short Chart since 1971 (3rd in a row)
The line chart is based on daily closings prices during the period 1971-2013. The TCI charts may help us measure and understand the Nasdaq historic returns. Here are some general conclusions deriving from the 2 TCI charts:
TCI LONG:
By investigating the TCI Long Chart we may observe a general indication of overbought levels above +50% while also a general indication of oversold levels for TCI Long below -50%.
TCI SHORT:
As concerns TCI short, we have a fantastic historic pattern here: 1) Each time TCI reaches +40% the trend is reversed immediately: -The level of TCI +40% indicates that the market is absolutely overbought: 2) Each time TCI drops at -45% the trend is also reversed immediately: -The level of TCI -45% indicates that the market is absolutely oversold.
Source: TradingCenter.org
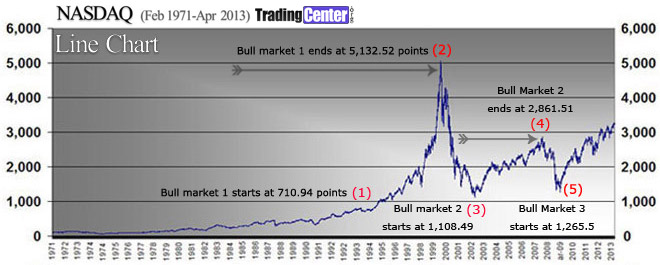
Nasdaq Historic Pattern (20 years)
If we concentrate in the last 20 years we are going to see clearly 3 bull markets, here they are:
(1) The bull market that started in 1994 and ended in 2000, when the bubble of the .coms suddenly crushed.
(2) The bull market that started in 2002 and ended in 2007, when the housing prices in the US started to drop, and we all know where that led in 2008.
(3) The current bull market that started in 2009 and it is expected to last until early 2014. Why until 2014? It is a statistical driven forecast that it is going to be analyzed and justified below.
THE 3 BULL MARKETS OF THE PAST 20 YEARS –DETAILS
Here are some details concerning the duration and the performance of each of the three Nasdaq bull markets.
1st Bull Market: 9-DECEMBER 1994 / 10-MARCH 2000
Starts: December 1994: Low 710.94 (close 719.05)
Ends: 10-March 2000: High 5.132.52 (close 5,048.62)
Total Return (High-Low): 4,329.57 Points
Total Return (%): 608.99%
Duration: 1,325 Trading Days (or 5 years and 3 months)
2nd Bull Market: 10-October-2002 / 31-October 2007
Starts: 10 OCTOBER 2002: Low 1,108.49 (close 1,165.37)
Ends: 31 October 2007: High 2,861.51 (close 2,859.12)
Total Return (High-Low): 1,693.75 Points
Total Return (%): 152.8%
Duration: 1,273 Trading Days (or 5 years and 1 month)
Source: TradingCenter.org
3rd Bull Market: 9 MARCH 2009 / FORECASTING THE TIME FRAME
The 3d Bull market has started in the 9th of MARCH 2009. Here is a past-driven forecast regarding the Nasdaq current bull market duration:
Started: 9 MARCH 2009: Low 1,265.50 (close 1,268.64)
Analysis: The two previous bull markets duration was about 1,300 days (average of 1,325 and 1,273). If we add 1,300 trading days to the March, 9th 2009, we get the start of spring of 2014, that means between March and April 2014.
Ends: MARCH-APRIL 2014
Keep in mind that this is just a statistical forecast.
FORECASTING NASDAQ PEAK (IN POINTS LEVEL)
The 3rd bullish market has already got over the 152.8% return of the 2nd bull market.
That is because:
1,265.50 x 152.8% = 1,933.7 points increase.
1.265.50 + 1,933.7 = 3,199.2 points.
Today Nasdaq is traded already above 3,200.
What can we expect in the future:
It is hard to tell but the optimistic scenario seems to be much more possible to occur. We could see in the next 12 months Nasdaq to trade at 3,800 or even at 4,150. The historic Nasdaq chart and the TCI Analysis show us that this movement may occur extremely fast and extremely aggressively in the next months.
THE IMPORTANT ASSUMPTION OF THE CURRENT NASDAQ FORECAST
As we have already mentioned in TradingCenter, the US economy for the moment is doing fine and for the rest of the year, 2013 is expected to react relative strong. The only concerns are again coming from Europe where the political conditions are not very good. We can not forecast the upcoming political developments in Europe, so we leave a possibility of 20%-30% that the political and economic crisis in Europe could get much worse and that could lead to a great global economic crisis. According to that scenario, Nasdaq will crush as every other capital market will.
◘ George Protonotarios, Financial Analyst
for Trading Center (April, 9th, 2013)
Forecasting Nasdaq using Historic Data
L MORE RESOURCES • COMPARE • PAIRS
□ Forex Brokers Comparison
□ Expert Advisors (EAs)
□ Fx Seasonality Calendar
□ TCI Forex Trade Signals
□ Reviews
» EURUSD
» GBPUSD
» USDJPY
» USDCHF
» USDCAD
» AUDUSD
