 A Historical Perspective on the Price of Gold
👉 J.P. Morgan said in 1912: "Gold is money, everything else is credit."
The total amount of gold available in the world today is about 156,000 tons. Each year, only 3,000 to 3,500 tons are mined. Most of this new supply goes to the jewelry industry, while the rest is used for investment. Since gold production is controlled and concentrated in a few countries, rising demand is often not matched by supply. Historically, gold was used as the world’s currency, and during financial crises, many investors view it as a “Safe Haven.” In such times, gold prices tend to rise sharply without any pauses or corrections. Investor psychology plays a key role in gold price movements, often outweighing the basic rules of supply and demand. In 2009, during the financial crisis, demand for gold dropped by 32%, yet prices still rose significantly.
Fundamental Highlights
- 208,000 metric tons of Gold is the total quantity that was ever mined (until 2024)
- Jewelry has used 95,000 tons, Central Banks 35,000 tons, Investment (bars, coins, etc.) 50,000 tons, and 30,000 went to manufacturing (electronics, space, etc.)
- Around 3,000–3,500 metric tons of Gold are mined per year (Top producing countries include China, Russia, Australia, Canada, and the U.S.)
- 25% of the new gold supply comes from recycling
📅 Gold Price Yearly Pattern
January is the best-performing month for gold, with April, July, August, and November also showing strong performance. Conversely, June is by far the worst month to hold gold. The chart below presents gold's annual trading pattern, based on market data from 2002 to 2025.
Chart: Gold Price Yearly Pattern (based on 23 years of data -2002-2025)
...")
📄 Research: Giorgos Protonotarios for TradingCenter.org
🪙 An Overview of Historical Gold Price Rallies
For hundreds of years, the gold price remained stable under systems like the Gold Standard and Bretton Woods, which are discussed later. However, after the 1970s, gold prices began to rise sharply due to high inflation and geopolitical tensions. These price movements reflect gold’s dual role as both a commodity and an investment safe haven. Thanks to detailed records kept by the United Kingdom, we can trace the price of gold year by year from 1257 until 1945, when the British Official Price ended. The chart below shows gold price movements in British Pounds per ounce. Note that in 1791, gold also began trading on the New York market.
Chart: The Price of Gold from 1257 to 1944 (British Official Price)

By observing the above chart, we can see that the gold market remained stable for hundreds of years. However, since 1970, it has entered a period of strong fluctuations, which continue to this day.
Gold Rally during the 70s
In 1971, the Bretton Woods system officially ended. At that time, gold was trading at only $41 per ounce. By 1980, the price had surged to over $600 per ounce. This gold rally in the 1970s was also driven by inflation concerns caused by the oil crisis during that period.
Chart: The Price of Gold from 1960 to 2011

Highlighting the Gold Market Cycles
The chart below illustrates a completed gold market cycle spanning 1970 to 1999, as well as a second cycle that began in 1999 and continues to the present. The current gold market cycle, which started in 1999, has developed a more extended structure compared to the earlier cycle (1970–1999).
Chart: Gold market cycles and the current rally

Greatest Gold Rallies of All Time
Here are the greatest gold price rallies of all time:
|
🐂 1970s Bull Run |
🐂 Lehman Brothers Crisis Rally |
🐂 Pandemic Rally (COVID-19) |
🐂 Inflation Hedge Rally (Ongoing) |
|
|
|
|
🏦 Agreements and Key Systems to Control the Price of Gold Until 1971
Gold Standard Rule
In 1871, the Gold Standard Rule was adopted by all industrialized countries. Under this system, the amount of money in circulation had to match the value of a country’s gold reserves. No country could issue new money without holding the equivalent value in gold. This rule helped control the global economy and historically kept inflation in check. However, its role started to decline after World War I. Germany, burdened with heavy war reparations, lacked the gold reserves to follow the rule and had to withdraw from the system. It became clear that the global monetary system could continue without it. The Gold Standard Rule officially ended in 1933 when a conference in London proposed a new system, later established as the Bretton Woods System. In 2009, Russia proposed bringing back the Gold Standard, but such a move is widely considered unrealistic and unlikely.
Bretton Woods Fixed Rate System
The Bretton Woods Fixed Rate System created a stable exchange rate between the currencies of 44 Allied countries after World War II. It placed the US Dollar at the center of the global monetary system, linking it to gold at a fixed rate of $35 per ounce. This system was officially abandoned in 1971.
Washington Agreement on Gold (WAG)
In 1999, the Washington Agreement on Gold was signed. Under this agreement, the central banks of the participating countries and organizations (including European nations, the US, Australia, the IMF, and BIS) agreed not to sell more than 500 tons of gold per year. Since 2004, this limit was reduced to 400 tons annually.

⛏️ The Key Features of Gold as a Precious Metal
(i) Gold Has Unique Characteristics
Gold is extremely durable and doesn’t corrode. It also conducts heat and electricity better than copper. These properties make it ideal for use in electronics such as mobile phones and microprocessors.
(ii) Gold as a Hedge Against Inflation
Gold has historically acted as a hedge against inflation. When the US Dollar loses value due to inflation, gold—priced in US Dollars—tends to increase in value. Historical gold prices also help economists calculate past values in today's terms.
(iii) High Demand from the Jewelry Industry
The jewelry industry is the main buyer of gold, accounting for about 45% of total annual demand.
(iv) Gold as a Reserve Currency
All central banks hold gold as part of their reserves. In addition, commercial banks, investment firms, and individual investors include gold in their portfolios. Holding gold helps diversify investments and reduce overall risk.
🪨 Precious Metals vs Industrial Metals
Metals are divided into two main categories: precious metals and industrial metals. A key difference between them is that precious metals do not react with oxygen, while industrial metals do.
- The three main precious metals are gold, silver, and platinum.
- The four main industrial metals are copper, aluminum, zinc, and lead.
The prices of industrial metals reflect the overall health of the global economy. When the economy is strong, there is more investment in housing and infrastructure, leading to higher demand and prices for industrial metals.
Traders of industrial metals often evaluate supply and demand by looking at stock levels reported by the major metal exchanges (COMEX/CME and LSE). Based on warehouse stocks:
(i) If stock levels are high, demand is likely low or production is high.
(ii) If stock levels are low, demand is likely high or production is low.
For precious metals, these patterns don’t always apply. Precious metals follow longer market cycles, often lasting a decade. About 35% of precious metals are used for investment, and 45% for jewelry. Their prices tend to spike during times of financial or political crisis, such as wars. Gold, in particular, is seen as a ‘safe haven’ during economic uncertainty.
📈 Aggregate Demand for Gold
-
Jewelry (45%) – China and India together account for half of the global demand for jewelry gold.
-
Investment Gold (35%) – Investment demand makes up more than one-third of total gold demand.
-
Central Bank Reserves (10%) – Central banks use gold as part of their reserve assets.
-
Industrial Applications (7%) – This includes electronics, fuel cells, and aerospace uses.
-
Other Demand (3%) – Includes uses such as dental applications and other minor uses.
🌐 Countries with the Highest Gold Reserves
According to the World Gold Council, the countries with the largest gold reserves are as follows.
Chart: Countries and Gold Reserves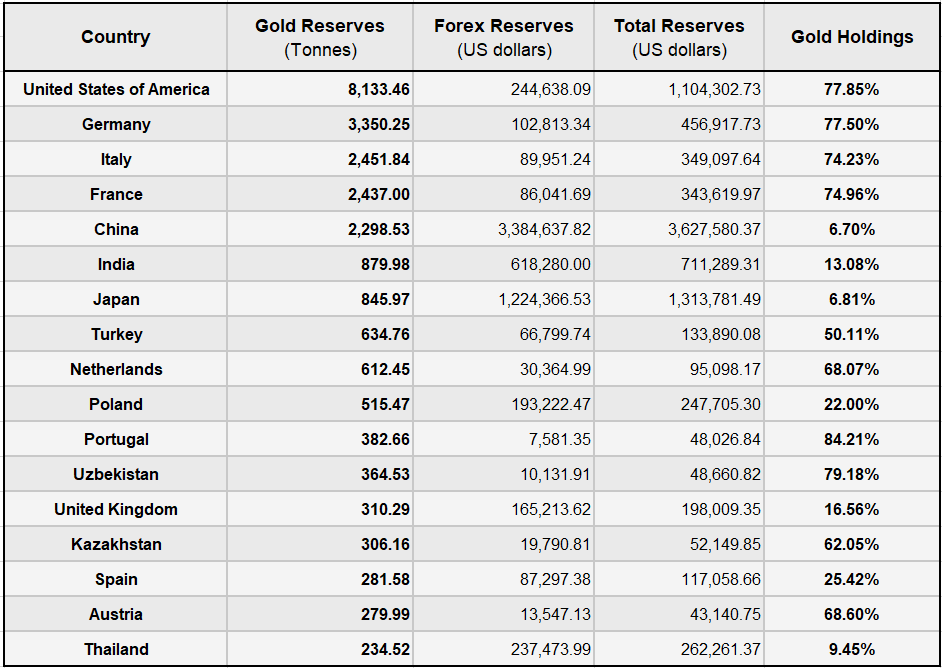
Source: World Gold Council (2025)
![]() Compare Gold Trading
Compare Gold Trading
This is a basic comparison of selected brokers that offer gold trading through CFDs. This comparison helps traders evaluate differences in costs, trading conditions, and broker features when choosing where to trade gold via CFDs.
Table: Compare Gold Trading
|
TRADING FEATURES |
 |
|
 |
|
□ PRECIOUS METALS ASSET INDEX |
XAUUSD
XAGUSD ETFs
|
GOLD PAIRS
|
|
|
□ GOLD CONTRACT INFO |
|
|
|
|
□ TRADE PLATFORMS |
MT4/MT5 RStocks Trader |
MT4/MT5 Ctrader |
MT4/MT5 |
|
□ TRADE ACCOUNTS |
Min. Deposit: 200 USD Funding Methods: Cards | Bank Wire | Skrill PerfectMoney | Neteller » Review RoboForex |
Min. Deposit: 200 USD Funding Methods: Credit Cards | Bank Wire Skrill | PayPal | Neteller |
Min. Deposit: 200 USD Funding Methods: Credit Cards | Bank Wire Skrill | UnionPay | Neteller |
|
□ MORE INFORMATION
|

🔗 Gold Analysis: Gold and Silver Market Cycles and the Gold-to-Silver Ratio
🔗 Sources:
- World Gold Council: https://www.gold.org
- https://GoldPrice.org
■ A Historical View of the Price of Gold
G.P. for TradingCenter.org (c)
You are not allowed to publish, reproduce, translate, merge, sell, rent, or distribute any content on this website (TradingCenter). You are not also allowed to create a derivative work or utilize framing techniques to enclose any content on this website (TradingCenter).
L MORE TUTORIALS • GENERAL GUIDES » Learning • TUTORIALS • OTHER RESOURCES
» Equity Trading
» Training
» Fundamental Analysis
» Rating Formulas
» RSI Precision
» Trading Books
» Forex Brokers
