US Dollar Index & Dow Jones Industrial (March-April 2017)
■ Markets: Foreign Exchange, Equity Markets
■ Assets: US Dollar Index (USDX) / US30 (DJIA)
Global Financial Markets –The General Outlook
After Donald Trump’s election, investors expect high inflation to return in the US. Several factors support this view, including Trump’s policies on tax cuts, increased public investment, and tariffs on imported industrial goods. Lower unemployment and rising wages also boost the chance of higher consumer prices ahead. These inflation expectations create positive momentum for the US Dollar and equity markets.
On the other hand, higher inflation usually means higher interest rates, which signals an end to the bullish bond market of the past 30 years. Since November 2016, about $4 trillion has shifted from bonds to equities.
Regarding equities, the VIX volatility index remains near historic lows, suggesting the equity rally will continue—at least for now.
Chart: CBOE VIX Volatility Chart (S&P500)
")
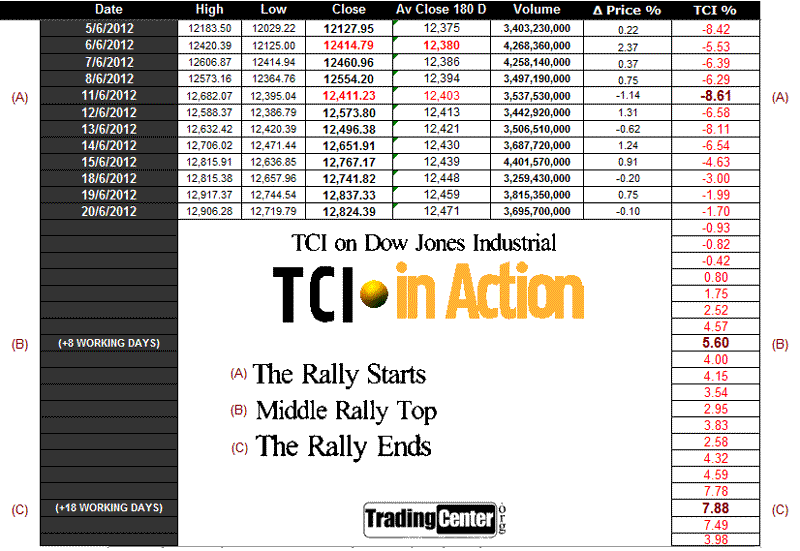
Applying TCI on USDX & Dow Jones Industrial
The Trading Center Indicator (TCI) is applied to the US Dollar Index (USDX) and the Dow Jones Industrial Average (DJIA). The chart below shows the daily TCI signals from November 2010 to March 2017. The USDX chart (top) includes the 89-day simple moving average (SMA), while the DJIA chart (bottom) shows the 144-day SMA.
 “Cash will be king again; it always is king in the end.”