 NASDAQ HISTORICAL PATTERNS & FORECAST USING TCI DATA
Nasdaq: Analyzing the Bull Markets Using TCI
Nasdaq is one of the world’s most popular and active stock markets. In this analysis, we will examine the Nasdaq Composite Index since 1971 using TCI analysis. We will focus on the three bull markets of the past 20 years. Our goal is to estimate how long the current Nasdaq bull market, which began in 2009, will last. 🔗 More: » Trading Center Indicator (TCI)
Nasdaq & TCI Charts (1971-2013)
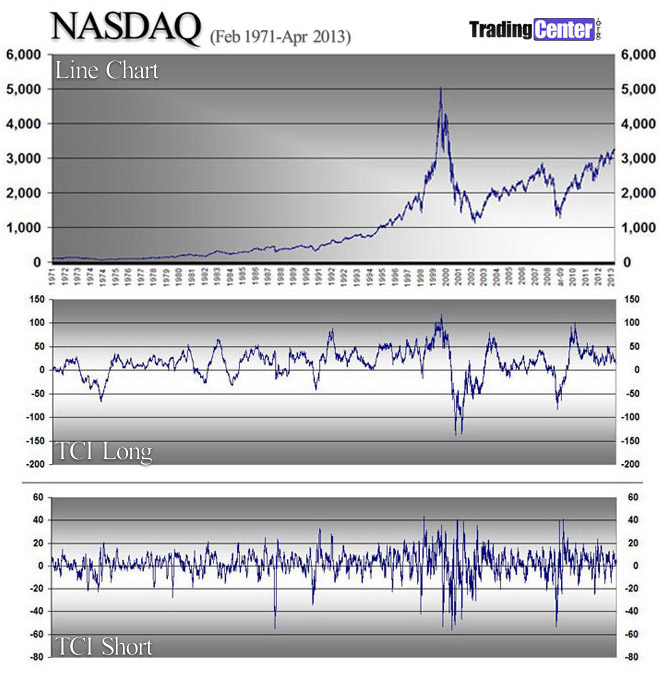
The following multi-chart consists of three individual charts:
1) Line Chart on Nasdaq Closings since 1971 (1st in a row chart)
2) TCI Long Chart since 1971 (2nd in a row)
3) TCI Short Chart since 1971 (3rd in a row)
The Nasdaq line chart below covers the period from 1971 to 2013. The TCI charts help us better understand Nasdaq’s historic returns.
Here are some key conclusions drawn from the two TCI charts:
□ TCI LONG:
By examining the TCI Long Chart, we see that levels above +50% generally indicate overbought conditions, while levels below -50% indicate oversold conditions.
□ TCI SHORT:
As concerns TCI short, we have a fantastic historical pattern here: 1) Each time TCI reaches +40% the trend is reversed immediately: -The level of TCI +40% indicates that the market is overbought: 2) Each time TCI drops by -45% the trend is also reversed immediately: -The level of TCI -45% indicates that the market is oversold.
Source: TradingCenter.org
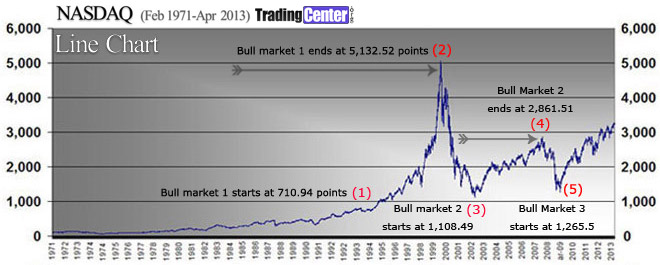
Nasdaq Historical Pattern (Last 20 Years)
Looking at the past 20 years, we can clearly see three bull markets:
-
The bull market from 1994 to 2000, which ended when the dot-com bubble suddenly burst.
-
The bull market from 2002 to 2007, which ended as US housing prices began to fall, leading to the 2008 crisis.
-
The current bull market, which started in 2009 and is expected to continue until early 2014. Why until 2014? This forecast is based on statistical analysis, which will be explained below.
THE 3 BULL MARKETS OF THE PAST 20 YEARS –DETAILS
Here are some details concerning the duration and the performance of each of the three Nasdaq bull markets.
1st Bull Market: 9-DECEMBER 1994 / 10-MARCH 2000
Starts: December 1994: Low 710.94 (close 719.05)
Ends: 10-March 2000: High 5.132.52 (close 5,048.62)
Total Return (High-Low): 4,329.57 Points
Total Return (%): 608.99%
Duration: 1,325 Trading Days (or 5 years and 3 months)
2nd Bull Market: 10-October-2002 / 31-October 2007
Starts: 10 OCTOBER 2002: Low 1,108.49 (close 1,165.37)
Ends: 31 October 2007: High 2,861.51 (close 2,859.12)
Total Return (High-Low): 1,693.75 Points
Total Return (%): 152.8%
Duration: 1,273 Trading Days (or 5 years and 1 month)
Source: TradingCenter.org
3rd Bull Market: March 9, 2009 / Forecasting the Time Frame
The third bull market began on March 9, 2009, with a low of 1,265.50 (closing at 1,268.64).
Analysis:
The previous two bull markets lasted about 1,300 trading days (an average of 1,325 and 1,273 days). Adding 1,300 trading days to March 9, 2009, points to early spring 2014—that is, between March and April 2014.
□ Expected End: March–April 2014. Keep in mind, this is only a statistical forecast.
Forecasting Nasdaq Peak (Point Level)
The current bull market has already surpassed the 152.8% return of the second bull market.
Calculation:
1,265.50 × 152.8% = 1,933.7 points increase
1,265.50 + 1,933.7 = 3,199.2 points
Today, Nasdaq is trading above 3,200 points.
What to Expect Next
It’s hard to predict exactly, but an optimistic scenario seems more likely. Over the next 12 months, Nasdaq could reach 3,800 or even 4,150 points. Historical Nasdaq charts and TCI analysis suggest this rise could happen very quickly and strongly.
The Important Assumption Behind This Forecast
As mentioned before, the US economy is doing well right now and is expected to improve further in 2013. The main concerns come from Europe, where political conditions are unstable. We cannot predict what will happen politically in Europe, so we allow a 20%–30% chance that the crisis there could worsen, possibly triggering a major global economic downturn. If that happens, Nasdaq, like other markets, would crash.
◘ George Protonotarios, Financial Analyst
for Trading Center (April, 9th, 2013)
Forecasting Nasdaq using Historic Data
L MORE RESOURCES • COMPARE • GLOBAL MARKETS • FOREX PAIRS • OTHER ASSETS
□ Forex Brokers Comparison
□ Expert Advisors (EAs)
□ Fx Seasonality Calendar
□ TCI Forex Trade Signals
□ Reviews
» Forex Market
» Equity Trading
» Commodities
» EURUSD
» GBPUSD
» USDJPY
» USDCHF
» USDCAD
» AUDUSD
» Historical Perspective on Gold Prices
» Crude Oil Trading
