
TradingCenter's Indicator (TCI) on the Dow Jones Industrial
Dow Jones Industrial has recently initiated a new short-term rally. The positive outcome of the Greek elections on June 17th and expectations that the Eurozone will soon offer a permanent and stable solution to the European banking crisis have renewed investor confidence. As a result, the Dow Jones Industrial Average (DJIA) closed at 12,824.39 on June 20th, 2012, significantly above its recent intraday low of 12,003.75 points recorded on June 4th, 2012. 🔗More » The Dow Jones Industrial Average
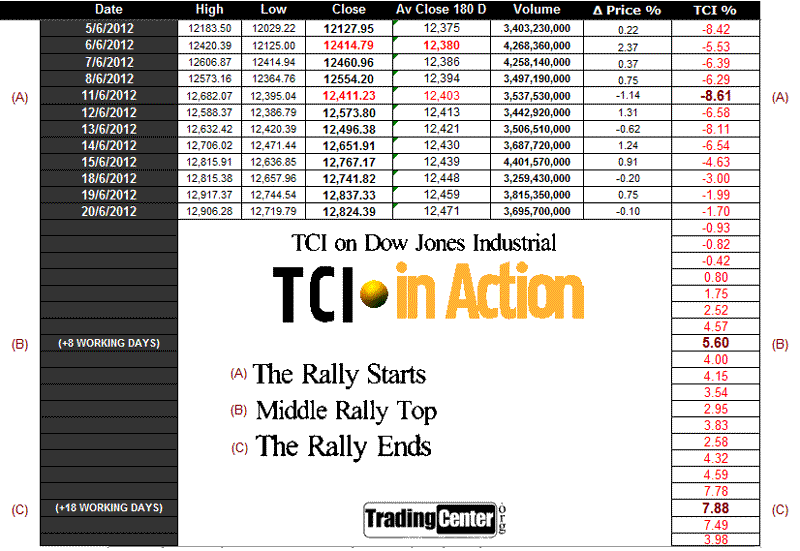
TCI in Action: Implementing the Trading Center Indicator on the Dow Jones Industrial
In the following table, you can observe the TCI in action. Point (A) marks the beginning of the current DJIA rally on June 11th, 2012. At point (A), the Dow closed at 12,411.23, which is above the 180-day Average Price of 12,403 points. This served as confirmation that a short-term rally was underway.
We have identified point (B) as the anticipated Middle Rally Top for the Dow Industrial. Point (B) falls 8 working days after June 20th, 2012, which corresponds to July 2nd, 2012.
 TCI Calculations – Dow at 13,070.00 / 13,590.00
We anticipate that the rally will peak at a TCI level of +10–14%, which translates to a 2%–6% increase from current price levels. In terms of index points, this represents a rise of 250 to 770 points. Therefore, we expect the Dow Jones Industrial Average to reach 13,070.00 to 13,590.00 points within the next three weeks.
◘ Giorgos Protonotarios
TradingCenter (2012)
L MORE RESOURCES • COMPARE • GLOBAL MARKETS • FOREX PAIRS • OTHER ASSETS
□ Forex Brokers Comparison
□ Expert Advisors (EAs)
□ Fx Seasonality Calendar
□ TCI Forex Trade Signals
□ Reviews
» Forex Market
» Equity Trading
» Commodities
» EURUSD
» GBPUSD
» USDJPY
» USDCHF
» USDCAD
» AUDUSD
» Historical Perspective on Gold Prices
» Crude Oil Trading
