The price of gold has dropped sharply, but the bear market appears to be nearing its end.
On Monday, April 15, gold fell below 1,340 USD per ounce. This bear market began on October 4, 2012, when gold closed at its peak of 1,791.8 USD per ounce. Now, with gold around 1,320 USD, the recent drop seems to have accelerated. Using TCI analysis, we will explore whether a bear market rally is about to start. 🔗 More » Historical Perspective of Gold Prices
| TRADING SIGNAL MARKET | CURRENT PRICE | TARGET | STOP LOSS |
|
|
$1,350 per ounce (4/15/2013) |
$1.459 $1.419
|
Stop-Loss: $1.319 per ounce |

But first, let’s review the results of our previous trading signal on Dow Jones Industrial (April 22, 2013).
The Previous TCI Trading Signal on Dow Jones Was Accurate
Our last signal predicted a bull market lasting until April 5–9, 2013. The bull market continued for three days longer than expected. Regarding the target price, we set a goal of 14,850 points, which was met with close precision. Dow Jones Industrial reached a high close of 14,865.14 and an intraday high of 14,887.51, both on April 11, 2013.
Here is what happened: Table: Dow Jones Industrial (March 22 – April 15) Date Open High Low Close Volume 26-Mar-13 14,447.75 14,561.54 14,447.75 14,559.65 960,300 27-Mar-13 14,559.65 14,559.65 14,439.55 14,526.16 926,800 28-Mar-13 14,526.16 14,585.10 14,520.86 14,578.54 1,537,100 1-Apr-13 14,578.54 14,605.72 14,531.48 14,572.85 914,000 2-Apr-13 14,572.85 14,684.49 14,572.85 14,662.01 984,200 3-Apr-13 14,662.01 14,683.13 14,525.36 14,550.35 1,271,400 4-Apr-13 14,550.35 14,625.24 14,538.72 14,606.11 1,047,900 5-Apr-13 14,606.11 14,606.11 14,434.43 14,565.25 1,312,500 8-Apr-13 14,565.25 14,613.48 14,497.80 14,613.48 1,066,800 9-Apr-13 14,613.48 14,716.46 14,598.50 14,673.46 1,285,800 10-Apr-13 14,673.46 14,826.66 14,673.46 14,802.24 1,205,200 11-Apr-13 14,802.24 14,887.51 14,785.36 14,865.14 1,445,700 12-Apr-13 14,865.14 14,865.21 14,790.57 14,865.06 1,195,700 15-Apr-13 14,865.06 14,865.06 14,598.58 14,599.20 1,616,800
The Gold Market from a Fundamental Perspective
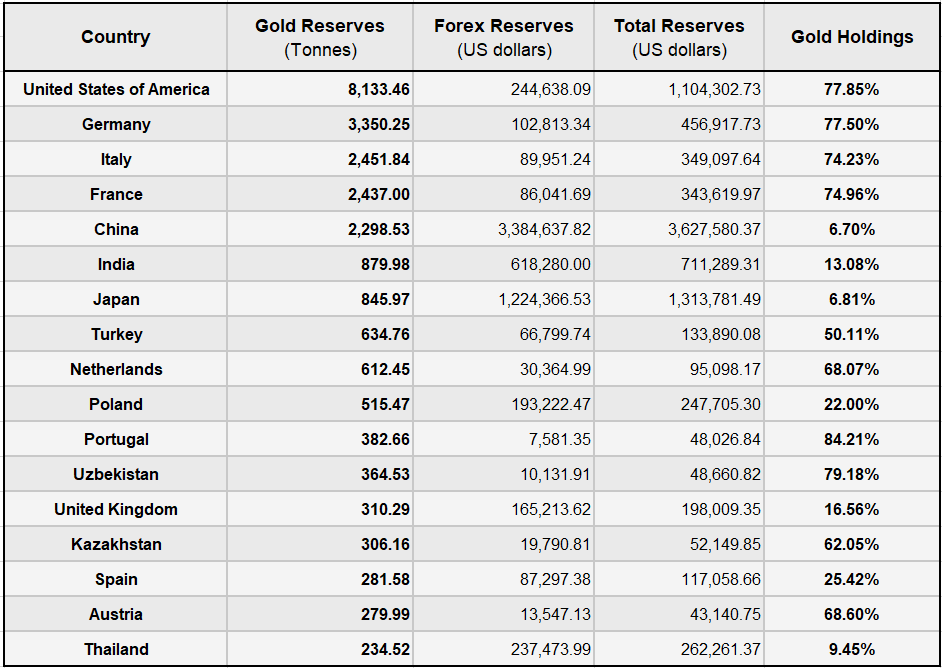
Two main factors explain the recent drop in gold prices. First, weak economic data from China has driven global gold demand over the past decade (for both jewelry and investment). China’s economic slowdown raised fears of falling demand in other markets, especially for metals and energy. Second, the Cypriot government’s plan to sell $500 million worth of gold to improve its public debt raised concerns that other troubled countries might follow. Southern European countries like Italy, Spain, and Portugal hold large gold reserves.
Here are the countries with the largest gold reserves:
Table: Countries & Gold Reserves Source: Wikipedia Now, here are the greatest gold reserves per person Chart: Countries & Gold Reserves
Country/Economic Region
Gold
(tonnes)% on Total Reserves
United States
8,133.5
76%
Germany
3,391.3
73%
International Monetary Fund
2,814.0
N.A.
Italy
2,451.8
72%
France
2,435.4
71%
China
1,054.1
2%
Switzerland
1,040.1
11%
Russia
957.8
9%
Japan
765.2
3%
Netherlands
612.5
60%
India
557.7
10%
European Central Bank
502.1
33%
Taiwan
423.6
6%
Portugal
382.5
90%
Venezuela
365.8
75%
Turkey
359.6
16%
Saudi Arabia
322.9
3%
United Kingdom
310.3
16%
Lebanon
286.8
29%
Spain
281.6
30%
Austria
280.0
55%
Belgium
227.5
39%
Philippines
192.7
12%
Algeria
173.6
5%
Thailand
152.4
4%
Other precious metals like silver and platinum, and many mining shares from around the world, were also hit in the past couple of days.
🔗 More: » Historical Price of Gold

What TCI Suggests About the Current Course of Gold
To assess gold’s near-term outlook, we use the TCI+ model. Unlike the standard TCI, TCI+ incorporates data from multiple currencies, not just the US Dollar. The TCI+ table below is based on gold prices measured in five currencies: USD, EUR, CHF, GBP, and JPY.
In the upper part of the chart, you’ll see a 20-year line chart of gold prices in USD (January 1983 to April 2013). The red line shows the 180-day moving average, which defines the main trend for gold. Currently, the 180-day moving average is around $1,688. The lower part of the chart displays the TCI+ signals over the same period.
Chart: The Price of Gold 1983–2013 and TCI+ Indications

If we look at gold’s bear markets over the past 20 years, TCI+ levels below -15% have indicated strong oversold conditions. In the past, these oversold levels were followed by significant gold price rallies. On April 15, 2013, TCI+ was at -14.0%, suggesting the bear market is likely coming to an end.
TCI+ Data Table
The table below shows gold prices during April 2013 alongside their corresponding TCI+ signals:
Date
Gold (USD)
MA 180
TCI+
3/1/2013
1,582.3
1,673.26
-3.83%
3/4/2013
1,574.3
1,673.28
-4.35%
3/5/2013
1,579.8
1,673.31
-4.10%
3/6/2013
1,574.0
1,673.31
-4.16%
3/7/2013
1,579.5
1,673.43
-3.06%
3/8/2013
1,581.8
1,673.33
-1.60%
3/11/2013
1,579.0
1,673.26
-1.18%
3/12/2013
1,594.0
1,673.13
-0.84%
3/13/2013
1,589.3
1,672.99
-1.43%
3/14/2013
1,586.0
1,672.89
-1.05%
3/15/2013
1,595.5
1,672.94
-1.38%
3/18/2013
1,603.8
1,673.05
-0.89%
3/19/2013
1,610.8
1,673.13
-0.95%
3/20/2013
1,607.5
1,673.30
-1.17%
3/21/2013
1,613.8
1,673.62
-0.88%
3/22/2013
1,607.8
1,673.69
-1.21%
3/25/2013
1,599.3
1,673.74
-1.18%
3/26/2013
1,598.0
1,673.81
-0.59%
3/27/2013
1,603.0
1,673.97
-0.14%
3/28/2013
1,598.3
1,674.05
-0.64%
3/29/2013
1,598.3
1,674.17
0.58%
4/1/2013
1,598.3
1,674.31
0.70%
4/2/2013
1,583.5
1,674.31
0.41%
4/3/2013
1,574.8
1,674.17
0.43%
4/4/2013
1,546.5
1,673.77
0.20%
4/5/2013
1,568.0
1,673.49
0.55%
4/8/2013
1,575.0
1,673.25
0.58%
4/9/2013
1,577.3
1,673.01
0.72%
4/10/2013
1,575.0
1,672.87
-0.07%
4/11/2013
1,565.0
1,672.69
-0.29%
4/12/2013
1,535.5
1,672.33
-2.23%
1,671.49
-6.76%
1,670.32
-10.90%
1,668.94
-13.35%
1,669.24
-13.78%
1,669.53
-14.56%
1,669.79
-14.60%
1,670.20
-15.24%
1,670.59
-15.20%
1,670.97
-14.88%
1,671.30
-14.82%
1,671.63
-15.28%
1,671.81
-15.96%
1,671.99
-15.93%
1,672.03
-16.03%
1,672.06
-15.54%
1,672.09
-15.15%
1,672.11
-15.18%
1,672.19
-15.65%
1,672.26
-15.32%
1,672.40
-15.12%
1,672.29
-14.89%
1,672.13
-14.37%
1,672.02
-13.60%
1,671.84
-12.66%
1,671.48
-13.11%
Based on the TCI+ analysis, buying gold between $1,320 and $1,350 per ounce could be very profitable for trading. The first target price is $1,419, and the second target is $1,459.
◘ Giorgos Protonotarios, Financial Analyst
For TradingCenter.org (c)
L MORE RESOURCES • COMPARE • GLOBAL MARKETS • FOREX PAIRS • OTHER ASSETS
□ Forex Brokers Comparison
□ Expert Advisors (EAs)
□ Fx Seasonality Calendar
□ TCI Forex Trade Signals
□ Reviews
» Forex Market
» Equity Trading
» Commodities
» EURUSD
» GBPUSD
» USDJPY
» USDCHF
» USDCAD
» AUDUSD
» Historical Perspective on Gold Prices
» Crude Oil Trading
