This EUR/USD technical analysis report is based on a 4-hour and 1-day MT4 chart, combined with the Trading Center Indicator (TCI) results.
📈 EURUSD Price Action and Short-Term Trend
Conclusions from the EUR/USD Price Action Analysis:
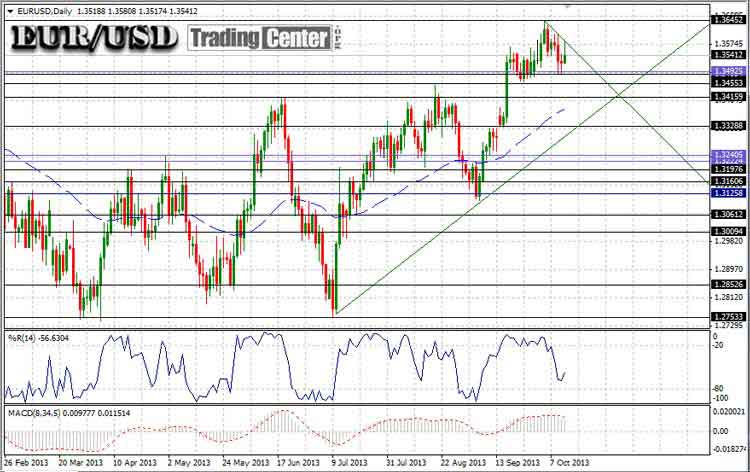
The 4-hour (H4) EUR/USD chart shows a downtrend, but the daily (D1) chart does not confirm this, indicating no clear short-term trend. If EUR/USD rises above 1.358, the short-term trend could turn bullish temporarily. Conversely, if EUR/USD falls decisively below 1.345, the trend would likely be strongly bearish.
■ Currently: 1.3541
■ Short-Term Bullish Trigger: 1.358
■ Strong Bearish Trigger: 1.345
Chart: EURUSD February 2013-October 2013

 eBOOK \"THE HIDDEN PATTERNS BEHIND 15 FOREX PAIRS\" AT AMAZON BOOKS")
🧮 TCI Short-Term Results
By applying TCI to EUR/USD, we obtained the following results.
Table TCI EURUSD Results:
| Date | Close | High | Low | Change (%) | Volatility (%) | TCI |
| 2013.09.12 | 1.32973 | 1.33239 | 1.32559 | -0.09% | 0.5% | 1.25% |
| 2013.09.13 | 1.32961 | 1.33206 | 1.32533 | -0.01% | 0.5% | 0.89% |
| 2013.09.16 | 1.33323 | 1.33847 | 1.33292 | 0.27% | 0.4% | 0.96% |
| 2013.09.17 | 1.33566 | 1.33684 | 1.33245 | 0.18% | 0.3% | 1.29% |
| 2013.09.18 | 1.35205 | 1.35408 | 1.33374 | 1.23% | 1.5% | 3.46% |
| 2013.09.19 | 1.35279 | 1.35677 | 1.35001 | 0.06% | 0.5% | 3.30% |
| 2013.09.20 | 1.35236 | 1.35478 | 1.3497 | -0.03% | 0.4% | 3.27% |
| 2013.09.23 | 1.34919 | 1.3547 | 1.34787 | -0.23% | 0.5% | 2.32% |
| 2013.09.24 | 1.34723 | 1.3518 | 1.34637 | -0.15% | 0.4% | 1.98% |
| 2013.09.25 | 1.35248 | 1.35362 | 1.34614 | 0.39% | 0.6% | 1.88% |
| 2013.09.26 | 1.34877 | 1.35298 | 1.34716 | -0.27% | 0.4% | 1.61% |
| 2013.09.27 | 1.3521 | 1.35637 | 1.34736 | 0.25% | 0.7% | 2.30% |
| 2013.09.30 | 1.35246 | 1.3555 | 1.3477 | 0.03% | 0.6% | 2.38% |
| 2013.10.01 | 1.35245 | 1.3587 | 1.35162 | 0.00% | 0.5% | 2.36% |
| 2013.10.02 | 1.35776 | 1.36062 | 1.35043 | 0.39% | 0.8% | 2.46% |
| 2013.10.03 | 1.36177 | 1.36454 | 1.35768 | 0.30% | 0.5% | 2.99% |
| 2013.10.04 | 1.35541 | 1.36309 | 1.35379 | -0.47% | 0.7% | 2.35% |
| 2013.10.07 | 1.35797 | 1.35903 | 1.35418 | 0.19% | 0.4% | 1.83% |
| 2013.10.08 | 1.3572 | 1.36063 | 1.35567 | -0.06% | 0.4% | 1.81% |
| 2013.10.09 | 1.3522 | 1.36037 | 1.34852 | -0.37% | 0.9% | 0.95% |
| 2013.10.10 | 1.35188 | 1.35453 | 1.34869 | -0.02% | 0.4% | 0.67% |
| 2013.10.11 | 1.35412 | 1.35808 | 1.35174 | 0.17% | 0.5% | 1.12% |
| (+1 trading day) | Regional Low | 0.76% | ||||
| (+2) | 0.97% | |||||
| (+3) | 1.46% | |||||
| (+4) | 1.02% | |||||
| (+5) | 1.15% | |||||
| (+6) | 1.18% | |||||
| (+7) | 1.06% | |||||
| (+8) | Regional High | 1.62% | ||||
| (+9) | Trend Reversal After | 1.17% | ||||
| (+10) | 0.96% | |||||
| (+11) | 0.89% | |||||
| (+12) | 0.67% | |||||
| (+13) | 0.71% | |||||
| (+14) | 0.56% | |||||
| (+15) | 0.44% | |||||
As shown in the table above, the EUR/USD TCI currently stands at +1.12%, down from its peak of +3.46% on September 18th. At the moment, the TCI does not indicate a clear trend. However, the most likely scenario is that EUR/USD will make one more attempt to reach a new high (within the next 8 trading days), followed by a probable trend reversal downward.
📊 EURUSD TCI Mid-Term Analysis
Today, the TCI stands at +1.12%, having reached a regional high of +3.46% in September. The following chart indicates that the overbought zone for TCI lies between +4% and +10%. Since these levels have not been reached recently, the EUR/USD market cannot be considered overbought. The TCI data shown covers the period from 2009 through today, October 13, 2013.
TCI Chart 2009-2013

Mid-Term EURUSD Cycle
The EUR/USD rally began in July 2013 when the exchange rate was around 1.275:
◘ Lowest Point: 1.2750 (July 9)
◘ Regional Low: 1.3104 (September 6)
◘ Highest Point: 1.3645 (October 3)
As we’ve seen multiple times in 2013, the European Central Bank aims to keep EUR/USD above 1.28. When the pair falls below 1.28, the ECB tends to intervene to support the euro. Keep in mind this intervention is unlikely to continue indefinitely and will probably end by the first half of 2014.
💹 A Few Words About Money Management, Leverage, and Trading Costs
Trading Center’s technical analysis reports do not focus on intraday trading, as intraday trends are difficult to predict and therefore not targeted. Instead, we trade over periods lasting between 2 and 10 days. The longer the timeframe, the less susceptible we are to ‘market noise.’ However, longer trading periods tend to incur higher swap charges. To keep trading costs low, it’s best to trade mid-term periods with lower leverage.
Leverage should not be seen as a trading ally but rather as a tool to amplify your trade size according to the individual trade’s weight. Using too much leverage on a small trade can collapse your entire money management system, leading to significant losses. Use leverage wisely, and always allow enough room for your stop-losses.
Remember, intraday technical analysis is not useless—it is valuable for identifying optimal entry and exit points. In other words, intraday analysis can provide the ‘trigger’ to execute your mid-term trades.
■ Giorgos Protonotarios, Financial Analyst
EURUSD Forex Trading Signal, for Trading Center, October 13th, 2013 (before opening)
L MORE RESOURCES • COMPARE • GLOBAL MARKETS • FOREX PAIRS • OTHER ASSETS
□ Forex Brokers Comparison
□ Expert Advisors (EAs)
□ Fx Seasonality Calendar
□ TCI Forex Trade Signals
□ Reviews
» Forex Market
» Equity Trading
» Commodities
» EURUSD
» GBPUSD
» USDJPY
» USDCHF
» USDCAD
» AUDUSD
» Historical Perspective on Gold Prices
» Crude Oil Trading
