
📈 The Australian Dollar is on the Move -TCI Analysis
Recently, the Australian Dollar has shown strong movement against other major currencies. Using MT4 technical analysis and the Trading Center Indicator (TCI), we will examine whether this trend is likely to continue or if we are nearing its completion, indicating a possible reversal. But first, let's review our previous Forex analysis on EURUSD.
Evaluation of the Previous Forex Signal on EURUSD
On October 11th, we published an analysis of EURUSD. At that time, there was no clear trend, but we noted that the most probable scenario was a new regional high forming: “the most probable scenario is that EURUSD will try once more to form a new high (+8 trading days), and after that, a trend reversal (↓) is very probable to occur.”
In that article, we also identified two key EURUSD levels:
■ Bullish Trigger: 1.358
■ Bearish Trigger: 1.345
■ EURUSD at that time: 1.3541
The EURUSD bullish trigger level of 1.358 was reached, followed by a strong uptrend to 1.3703. Looking at the TCI indication table in that same article, we can see that TCI forecasted a regional high of +8 trading days. That places the high 8 trading days after October 11th—namely, Wednesday, October 23rd. That date is approaching, and we will soon be able to assess the accuracy of the TCI projection made on October 11th.
The Australian Dollar against the Euro, US Dollar, and British Sterling
□ We are going to analyze the Australian Dollar against the EUR, USD, and GBP.
First, it is important to understand that the Australian Dollar has been under significant selling pressure over the past year, particularly since the summer of 2012. During that time, EURAUD was trading around 1.16, while by the summer of 2013, it had reached a new high above 1.50. This is a substantial move with strong implications for Australia's real economy. From this perspective, the current correction of the Australian Dollar against the EUR, USD, and GBP appears entirely reasonable. The key question now is whether this movement is purely corrective or if there is a high probability of a new trend forming.
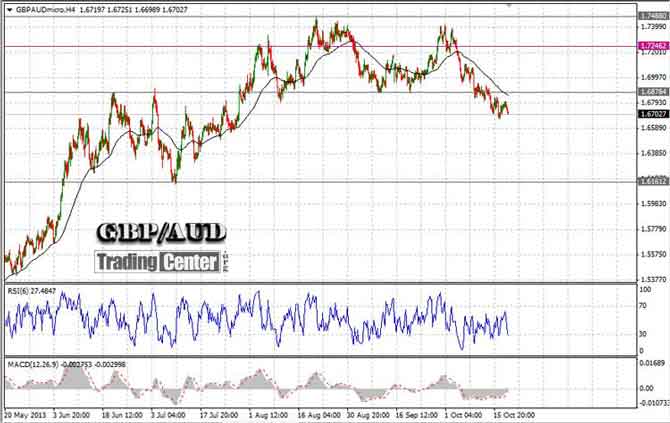
British Sterling (GBP) against the Australian Dollar (AUD)
□ Currently at 1.67027
GBP/AUD is clearly moving in a downtrend. Price action on the H4 chart shows a declining market, and this is strongly confirmed on the D1 chart as well. A major mid-term support level is found at 1.6589. Other significant mid-term support levels include 1.6385 and, further down, 1.6160. However, this is based solely on price action, and additional analysis is necessary before drawing any firm conclusions.
Looking at the following TCI indications, we see that GBPAUD may be nearing the end of its downtrend. The formation could be completed in either 4 or 9 trading days: Thursday, October 24th, 2013, or Friday, November 1st, 2013.
According to TCI, an uptrend is likely to emerge around that time.
GBP/AUD TCI Table
These are the upcoming TCI indications for the British Sterling (GBP) against the Australian Dollar (AUD).
| Date | Close | High | Low | Change (%) | Volatility (%) | TCI |
| 2013.09.19 | 1.69801 | 1.70041 | 1.68707 | 0.16% | 0.8% | -2.72% |
| 2013.09.20 | 1.70299 | 1.70512 | 1.69528 | 0.29% | 0.6% | -1.85% |
| 2013.09.23 | 1.70031 | 1.70797 | 1.69554 | -0.16% | 0.7% | -1.21% |
| 2013.09.24 | 1.70373 | 1.70618 | 1.6983 | 0.20% | 0.5% | -1.26% |
| 2013.09.25 | 1.71621 | 1.7181 | 1.70294 | 0.73% | 0.9% | 0.49% |
| 2013.09.26 | 1.71269 | 1.71885 | 1.70659 | -0.21% | 0.7% | 0.90% |
| 2013.09.27 | 1.73106 | 1.73304 | 1.71055 | 1.07% | 1.3% | 2.66% |
| 2013.09.30 | 1.73631 | 1.74103 | 1.72642 | 0.30% | 0.8% | 2.99% |
| 2013.10.01 | 1.72283 | 1.74183 | 1.72068 | -0.78% | 1.2% | 1.39% |
| 2013.10.02 | 1.72817 | 1.73871 | 1.71875 | 0.31% | 1.2% | 1.13% |
| 2013.10.03 | 1.71823 | 1.73239 | 1.71738 | -0.57% | 0.9% | 0.82% |
| 2013.10.04 | 1.69676 | 1.72072 | 1.69537 | -1.24% | 1.5% | -2.35% |
| 2013.10.07 | 1.70620 | 1.71079 | 1.69727 | 0.55% | 0.8% | -1.76% |
| 2013.10.08 | 1.70592 | 1.70801 | 1.6953 | -0.02% | 0.7% | -1.87% |
| 2013.10.09 | 1.68861 | 1.70775 | 1.68343 | -1.02% | 1.4% | -3.06% |
| 2013.10.10 | 1.68895 | 1.69528 | 1.68442 | 0.02% | 0.6% | -2.74% |
| 2013.10.11 | 1.68432 | 1.69289 | 1.68094 | -0.27% | 0.7% | -2.90% |
| 2013.10.14 | 1.68338 | 1.69376 | 1.68175 | -0.06% | 0.7% | -3.86% |
| 2013.10.15 | 1.67880 | 1.68559 | 1.67076 | -0.27% | 0.9% | -4.03% |
| 2013.10.16 | 1.66907 | 1.68439 | 1.66771 | -0.58% | 1.0% | -4.75% |
| 2013.10.17 | 1.67721 | 1.67885 | 1.6663 | 0.49% | 0.8% | -4.02% |
| 2013.10.18 | 1.67027 | 1.68058 | 1.66989 | -0.41% | 0.6% | -4.38% |
| -3.86% | ||||||
| -3.12% | ||||||
| -2.82% | ||||||
| -3.09% | ||||||
| -2.88% | ||||||
| -2.58% | ||||||
| -2.90% | ||||||
| -2.71% | ||||||
| -3.13% | ||||||
| -2.66% | ||||||
| -1.79% | ||||||
| -1.84% | ||||||
| -1.95% | ||||||
| -1.78% | ||||||
| -1.68% | ||||||
| -1.69% | ||||||
| -2.03% | ||||||
| -1.89% | ||||||
| -2.28% |
Euro (EUR) against the Australian Dollar (AUD)
□ Information about the pair: » EURAUD
□ Currently at 1.41393
EURAUD price action indicates a clear downtrend on the H4 chart, a signal that is strongly confirmed by the D1 chart as well. Based on current momentum, we could see EURAUD reaching 1.3970, or even 1.3860, in the coming weeks. However, this outlook is purely based on price action, and caution is warranted, as upcoming news events may significantly impact supply and demand levels in the currency market. TCI once again suggests the nearing completion of the downtrend cycle. Key dates for the potential end of the downtrend and the emergence of a new trend are 4 and 9 trading days ahead: Thursday, October 24th, 2013, and Friday, November 1st, 2013.
The upcoming TCI indications for the Euro (EUR) against the Australian Dollar (AUD)
EUR /AUD TCI Table
| Date | Close | High | Low | Change (%) | Volatility | TCI |
| 2013.09.19 | 1.43305 | 1.4344 | 1.41961 | 0.92% | 1.0% | -4.10% |
| 2013.09.20 | 1.43916 | 1.43958 | 1.43027 | 0.43% | 0.7% | -2.50% |
| 2013.09.23 | 1.43019 | 1.44563 | 1.42713 | -0.63% | 1.3% | -3.25% |
| 2013.09.24 | 1.43437 | 1.43907 | 1.43031 | 0.29% | 0.6% | -2.84% |
| 2013.09.25 | 1.44364 | 1.44497 | 1.43378 | 0.65% | 0.8% | -1.32% |
| 2013.09.26 | 1.44028 | 1.44551 | 1.43631 | -0.23% | 0.6% | -1.10% |
| 2013.09.27 | 1.45063 | 1.45582 | 1.43847 | 0.72% | 1.2% | 0.11% |
| 2013.09.30 | 1.45116 | 1.45369 | 1.44521 | 0.04% | 0.6% | 0.42% |
| 2013.10.01 | 1.43880 | 1.45503 | 1.43572 | -0.85% | 1.3% | -0.97% |
| 2013.10.02 | 1.44643 | 1.4542 | 1.43633 | 0.53% | 1.2% | -0.52% |
| 2013.10.03 | 1.44877 | 1.45449 | 1.44569 | 0.16% | 0.6% | 0.50% |
| 2013.10.04 | 1.43678 | 1.45069 | 1.43343 | -0.83% | 1.2% | -1.57% |
| 2013.10.07 | 1.43977 | 1.44646 | 1.4354 | 0.21% | 0.8% | -1.94% |
| 2013.10.08 | 1.43981 | 1.44099 | 1.43061 | 0.00% | 0.7% | -1.97% |
| 2013.10.09 | 1.43148 | 1.44114 | 1.42732 | -0.58% | 1.0% | -2.68% |
| 2013.10.10 | 1.43015 | 1.43671 | 1.42685 | -0.09% | 0.7% | -2.82% |
| 2013.10.11 | 1.42986 | 1.43528 | 1.42717 | -0.02% | 0.6% | -2.68% |
| 2013.10.14 | 1.42849 | 1.43819 | 1.42724 | -0.10% | 0.8% | -3.74% |
| 2013.10.15 | 1.41919 | 1.42998 | 1.41408 | -0.65% | 1.1% | -4.57% |
| 2013.10.16 | 1.41649 | 1.4239 | 1.41434 | -0.19% | 0.7% | -4.37% |
| 2013.10.17 | 1.41897 | 1.42368 | 1.414 | 0.17% | 0.7% | -4.05% |
| 2013.10.18 | 1.41393 | 1.42213 | 1.41321 | -0.36% | 0.6% | -4.33% |
| -3.82% | ||||||
| -2.82% | ||||||
| -2.50% | ||||||
| -2.73% | ||||||
| -2.60% | ||||||
| -2.19% | ||||||
| -2.26% | ||||||
| -2.14% | ||||||
| -2.39% | ||||||
| -2.15% | ||||||
| -1.64% | ||||||
| -1.37% | ||||||
| -1.87% | ||||||
| -1.97% | ||||||
| -1.50% | ||||||
| -1.58% | ||||||
| -1.85% | ||||||
| -1.54% |
Australian Dollar (AUD) against the US Dollar (USD)
□ Information about the pair: » AUDUSD
□ Currently at 0.96752
As with GBPAUD and EURAUD, price action favors the Australian Dollar. This is confirmed by both the H4 and D1 charts. The key difference here is that AUDUSD is closer to its major resistance levels than the other two pairs were to their support levels. Strong resistance is found at 0.973, followed by another level at 0.9820. TCI indicates an overbought market approaching completion. Key dates for the potential end of this move are 3 and 9 trading days ahead: Wednesday, October 23rd, 2013, and Friday, November 1st, 2013.
AUD/USD TCI Table
The upcoming TCI indications for the Australian Dollar (AUD) against the US Dollar (USD)
| Date | Close | High | Low | Change (%) | Volatility | TCI |
| 2013.09.19 | 0.94359 | 0.95231 | 0.94262 | -0.86% | 1.0% | 7.04% |
| 2013.09.20 | 0.93945 | 0.94572 | 0.93768 | -0.44% | 0.9% | 5.50% |
| 2013.09.23 | 0.94288 | 0.94558 | 0.93649 | 0.36% | 1.0% | 5.11% |
| 2013.09.24 | 0.93890 | 0.94297 | 0.93626 | -0.42% | 0.7% | 4.48% |
| 2013.09.25 | 0.93657 | 0.93925 | 0.93374 | -0.25% | 0.6% | 3.01% |
| 2013.09.26 | 0.93597 | 0.94005 | 0.93392 | -0.06% | 0.7% | 2.45% |
| 2013.09.27 | 0.93147 | 0.93739 | 0.92966 | -0.48% | 0.8% | 1.95% |
| 2013.09.30 | 0.93149 | 0.93531 | 0.928 | 0.00% | 0.8% | 1.82% |
| 2013.10.01 | 0.93959 | 0.94343 | 0.92876 | 0.87% | 1.6% | 3.38% |
| 2013.10.02 | 0.93835 | 0.94099 | 0.93326 | -0.13% | 0.8% | 3.05% |
| 2013.10.03 | 0.93931 | 0.9414 | 0.9366 | 0.10% | 0.5% | 2.40% |
| 2013.10.04 | 0.94317 | 0.94575 | 0.93877 | 0.41% | 0.7% | 3.88% |
| 2013.10.07 | 0.94258 | 0.94483 | 0.93871 | -0.06% | 0.7% | 3.48% |
| 2013.10.08 | 0.94222 | 0.94832 | 0.94109 | -0.04% | 0.8% | 3.57% |
| 2013.10.09 | 0.94424 | 0.94634 | 0.94122 | 0.21% | 0.5% | 3.48% |
| 2013.10.10 | 0.94492 | 0.94707 | 0.93882 | 0.07% | 0.9% | 3.43% |
| 2013.10.11 | 0.94663 | 0.94836 | 0.9434 | 0.18% | 0.5% | 3.80% |
| 2013.10.14 | 0.94872 | 0.95061 | 0.94243 | 0.22% | 0.9% | 4.63% |
| 2013.10.15 | 0.95252 | 0.95464 | 0.94771 | 0.40% | 0.7% | 5.36% |
| 2013.10.16 | 0.95508 | 0.95559 | 0.94979 | 0.27% | 0.6% | 5.86% |
| 2013.10.17 | 0.96345 | 0.9646 | 0.95262 | 0.88% | 1.3% | 6.96% |
| 2013.10.18 | 0.96752 | 0.96761 | 0.96033 | 0.42% | 0.8% | 7.53% |
| 6.99% | ||||||
| 5.88% | ||||||
| 6.14% | ||||||
| 5.54% | ||||||
| 5.15% | ||||||
| 4.70% | ||||||
| 4.37% | ||||||
| 4.31% | ||||||
| 4.37% | ||||||
| 4.07% | ||||||
| 3.59% | ||||||
| 2.34% | ||||||
| 2.79% | ||||||
| 2.99% | ||||||
| 2.70% | ||||||
| 2.84% | ||||||
| 2.82% | ||||||
| 2.76% | ||||||
| 2.90% | ||||||
| 2.58% | ||||||
| 1.90% |
■ Giorgos Protonotarios, Financial Analyst
for TradingCenter.org (c)
Forex Trading Signals using TCI -October 20th ,2013 (before opening)
L MORE RESOURCES • COMPARE • GLOBAL MARKETS • FOREX PAIRS • OTHER ASSETS
□ Forex Brokers Comparison
□ Expert Advisors (EAs)
□ Fx Seasonality Calendar
□ TCI Forex Trade Signals
□ Reviews
» Forex Market
» Equity Trading
» Commodities
» EURUSD
» GBPUSD
» USDJPY
» USDCHF
» USDCAD
» AUDUSD
» Historical Perspective on Gold Prices
» Crude Oil Trading
