 Forex Trading Signals: EURUSD and EURAUD February 2014
In this analysis, we will evaluate EURUSD and EURAUD for February 2014 using the TCI technical analysis model. According to this report, EUR/USD has nearly completed a downtrend cycle and is likely to enter an uptrend correction in early February. Meanwhile, EUR/AUD has recently shown strong overbought signals and is currently undergoing a correction.
As always, before diving deeper into the current Forex market conditions, let’s review our previous trading analysis on EUR/USD published on January 10th, 2014.
Previous Forecast on EUR/USD → PRESS THE SLIDE-BAR
In our previous signal (January 10th, 2014), we forecasted a high probability of a downtrend for EUR/USD. At that time, EUR/USD was trading at 1.36681. Today, it is trading at 1.34864, and the downtrend has been fully confirmed within the forecasted timeframe (January 2014).
» Find the full EURUSD Analysis here...
{/slider}
FOREX TRADING SIGNALS -FEBRUARY 2014
(I) EURUSD ANALYSIS
Currently: 1.3668 | Starting with statistics, and later presenting the TCI indications for EURUSD.
EURUSD Statistics for the Month of February 2014
According to TradingCenter.org analysis, during the past 13 years, the Euro against the US Dollar has usually been weak, as concerns the first two months of each year.
■ January, on average -0.76% {6↑ 8↓}
■ February, on average -0.29% {7↑ 7↓}
Let’s find out what happens next regarding EURUSD using the TCI model..
TCI Technical Analysis Model on EURUSD
In the following table, you will find the TCI indications for EUR/USD for February 2014. Each TCI indication corresponds to a specific future trading day based on our model settings. This allows us to not only identify the expected trend but also the timing of potential market movements.
Notably, the TCI forecast includes market openings on late Sundays, as our historical data feed incorporates six trading days per week instead of the usual five. This enhances the model’s ability to capture weekend price action and early market trends.
It is important to remember that TCI is not a crystal ball — no model can perfectly predict the future. Instead, it forecasts the most probable price pattern, assuming neutral or only mild market-moving news in the currency markets.
Settings: TCI v1.2 | 1-Day → PRESS THE SLIDE-BAR BELOW
{slider=TCI ON EURUSD}
Table: TCI on EURUSD (February 2014)
|
Date |
Close |
High |
Low |
Change |
Volatility |
TCI |
|
2014.01.31 |
1.34864 |
1.35722 |
1.34783 |
-0.49% |
0.7% |
-2.38% |
|
(+1 Trading Days) February, 2nd |
Possible Uptrend Correction |
|
|
-1.96% |
||
|
(+2 Trading Days) February, 3rd |
Downtrend -Local Low |
|
|
-2.22% |
||
|
(+3 Trading Days) February,4th |
Stronger Uptrend Correction (3 days) |
|
|
-2.06% |
||
|
(+4 Trading Days) February, 5th |
|
|
|
-1.32% |
||
|
(+5 Trading Days) February, 6th |
Uptrend -Local High |
|
|
-1.18% |
||
|
(+6 Trading Days) February, 7th |
Downtrend Correction |
|
|
-1.38% |
||
|
(+7 Trading Days) February, 9th |
Downtrend -Local Low |
|
|
-1.63% |
||
|
(+8 Trading Days) February, 10th |
New Uptrend |
|
|
-1.45% |
||
|
(+9 Trading Days) February, 11th |
|
|
|
-1.29% |
||
|
(+10 Trading Days) February, 12th |
Correction |
|
|
-1.41% |
||
|
(+11 Trading Days) February, 13th |
|
|
|
-1.45% |
||
|
(+12 Trading Days) February, 14th |
Uptrend Continues |
|
|
-1.23% |
||
|
(+13 Trading Days) February, 16th |
|
|
|
-0.80% |
||
|
(+14 Trading Days) February, 17th |
Uptrend -Local High |
|
|
-0.40% |
||
|
(+15 Trading Days) February, 18th |
Downtrend |
|
|
-0.97% |
||
|
(+16 Trading Days) February, 19th |
|
|
|
-0.82% |
||
|
(+17 Trading Days) February, 20th |
|
|
|
-0.62% |
||
|
(+18 Trading Days) February, 21st |
|
|
|
-0.78% |
||
|
(+19 Trading Days) February, 23rd |
Downtrend -Local Low |
|
|
-1.09% |
||
|
(+20 Trading Days) February, 24th |
New Uptrend |
|
|
-0.84% |
||
|
(+21 Trading Days) February, 25th |
|
|
|
-0.69% |
||
|
(+22 Trading Days) February, 26th |
|
|
|
-0.40% |
||
|
(+23 Trading Days) February, 27th |
|
|
|
-0.45% |
||
|
(+24 Trading Days) February, 28th |
Uptrend Local High |
|
|
-0.14% |
||
* As a reminder, February 17, 2014, is Presidents' Day in the US.
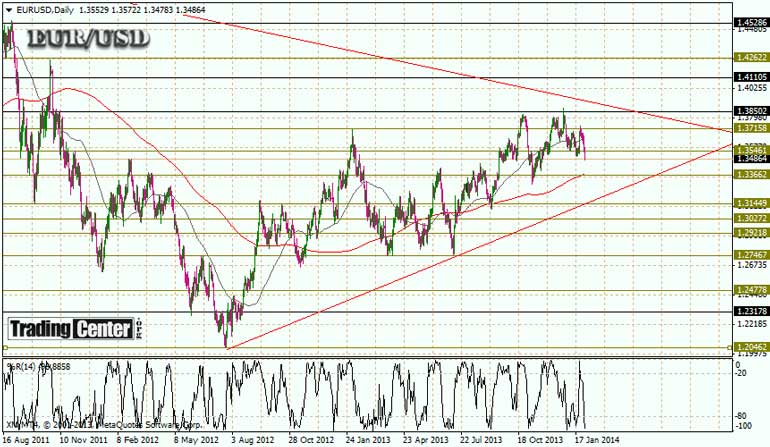
Based on the TCI results, EUR/USD is currently trading at oversold levels and is likely to see an upward correction early in the coming week. According to TCI, a good trading opportunity may arise around February 4, 2014, with an entry point then and completion expected within the next two days. Following this, we anticipate mixed trends lasting 2–3 days, followed by corrective movements.
Note: For the first time, the TCI Indications table includes specific comments for individual dates regarding EUR/USD in February 2014. As always, the purpose of TCI is to forecast the most probable price patterns, not to predict the future with certainty.
Below is the EUR/USD daily chart featuring Williams %R at the bottom and two simple moving averages — the 50-day and 200-day — to help with trend analysis.
Chart: EUR/USD (1 Day)
(II) EURAUD ANALYSIS
- Current EURAUD Price: 1.5398
EURAUD Statistics for February
According to TradingCenter.org’s analysis over the past 13 years, the Euro typically shows weakness against the Australian Dollar in January and especially in February. Historically, in February, the Euro has underperformed 11 times and outperformed only 3 times — but remember, this is purely statistical and doesn’t guarantee future performance.
-
January average: -0.54% (6 up / 8 down)
-
February average: -0.46% (3 up / 11 down)
TCI Technical Analysis Model on EURAUD
Below is the table of TCI indications for EURAUD for February 2014.
Settings: TCI v1.2 | 1-Day
{slider=TCI ON EURAUD}
Table: TCI on EURAUD (February 2014)
|
Date |
Close |
High |
Low |
Change |
Volatility |
TCI |
|
2014.01.28 |
1.55679 |
1.56669 |
1.5486 |
-0.44% |
1.2% |
2.22% |
|
2014.01.29 |
1.56291 |
1.56519 |
1.54726 |
0.39% |
1.2% |
3.78% |
|
2014.01.30 |
1.54079 |
1.56712 |
1.54069 |
-1.42% |
1.7% |
0.06% |
|
2014.01.31 |
1.53989 |
1.55873 |
1.53593 |
-0.06% |
1.5% |
-1.38% |
|
(+1 Trading Days) February, 2nd |
Possible Uptrend Reaction (1-day) |
|
-0.45% |
|||
|
(+2 Trading Days) February, 3rd |
|
|
|
-0.90% |
||
|
(+3 Trading Days) February,4th |
Local Low |
|
|
-1.50% |
||
|
(+4 Trading Days) February, 5th |
Possible Uptrend Correction |
-0.73% |
||||
|
(+5 Trading Days) February, 6th |
|
|
|
-0.56% |
||
|
(+6 Trading Days) February, 7th |
Local High |
|
0.06% |
|||
|
(+7 Trading Days) February, 9th |
New Downtrend |
|
-0.04% |
|||
|
(+8 Trading Days) February, 10th |
|
|
|
-0.53% |
||
|
(+9 Trading Days) February, 11th |
|
|
|
-0.51% |
||
|
(+10 Trading Days) February, 12th |
Local Low |
|
|
-1.14% |
||
|
(+11 Trading Days) February, 13th |
New Uptrend |
|
-1.12% |
|||
|
(+12 Trading Days) February, 14th |
|
|
|
-0.51% |
||
|
(+13 Trading Days) February, 16th |
|
|
|
-0.18% |
||
|
(+14 Trading Days) February, 17th |
Local High |
|
0.56% |
|||
|
(+15 Trading Days) February, 18th |
Downtrend Correction |
|
-0.19% |
|||
|
(+16 Trading Days) February, 19th |
Local Low |
|
|
-0.57% |
||
|
(+17 Trading Days) February, 20th |
New Uptrend |
|
-0.30% |
|||
|
(+18 Trading Days) February, 21st |
|
|
|
-0.28% |
||
|
(+19 Trading Days) February, 23rd |
|
|
|
-0.08% |
||
|
(+20 Trading Days) February, 24th |
Local High |
|
0.76% |
|||
|
(+21 Trading Days) February, 25th |
Downtrend Correction |
|
0.29% |
|||
|
(+22 Trading Days) February, 26th |
|
|
|
0.32% |
||
|
(+23 Trading Days) February, 27th |
|
|
|
-0.30% |
||
|
(+24 Trading Days) February, 28th |
|
|
|
-0.17% |
||
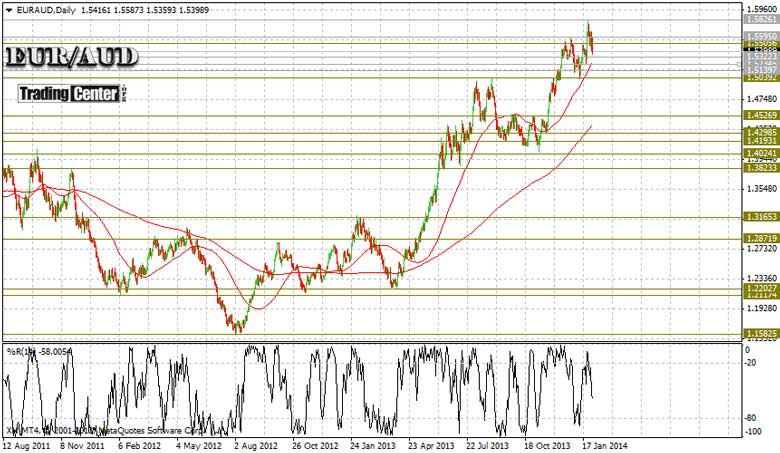
According to the TCI model, EURAUD was recently at highly overbought levels. On January 24th, 2014, the TCI indicated +4.47% for EURAUD (around 1.5745), signaling an overbought condition. Following this, a strong downtrend correction occurred, and today EURAUD is trading near 1.5399.
Similar to EURUSD, we expect the EURAUD downtrend to bottom around February 4th, 2014. After that date, a potential uptrend correction could take place.
Below is the MT4 chart for EURAUD (1Day), featuring Williams %R at the bottom and two simple moving averages on the chart (50-day and 200-day).
Chart: EURAUD (D1)
Free Forex Trading Signals: EURUSD and EURAUD February 2014
■ George Protonotarios, Financial Analyst, Trading Center.org (February, 1st 2014)
L MORE RESOURCES • COMPARE • GLOBAL MARKETS • FOREX PAIRS • OTHER ASSETS
□ Forex Brokers Comparison
□ Expert Advisors (EAs)
□ Fx Seasonality Calendar
□ TCI Forex Trade Signals
□ Reviews
» Forex Market
» Equity Trading
» Commodities
» EURUSD
» GBPUSD
» USDJPY
» USDCHF
» USDCAD
» AUDUSD
» Historical Perspective on Gold Prices
» Crude Oil Trading
