📶 Forex Trading Signals using Trading Center's Technical Analysis System (TCI)
![]()
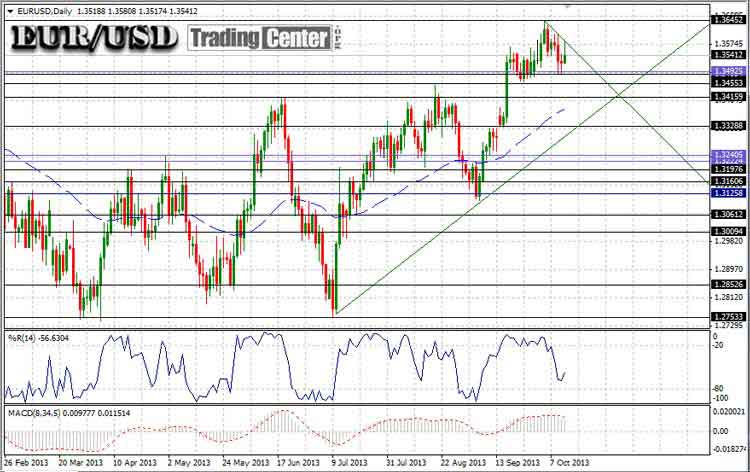
🌐 EURUSD -The Euro against the US Dollar
Currently, EURUSD is trading at 1.34874, correcting from its recent high of 1.38314 reached on October 25, 2013. In two recent Forex Signal articles, we predicted that EURUSD would form a new mid-term high in late October, with the 23rd of October indicated as a possible date using TCI. In reality, EURUSD reached its high two days later, on October 25. Considering the forecast was made on October 13, this was a reasonably accurate prediction.
Using Price Action and TCI, we will now analyze what may happen next for EURUSD and AUDUSD.
📈 EURUSD Price Action
The current EURUSD price action is clearly bearish on both the H1 and H4 charts, with confirmation on the D1 chart as well. However, the longer-term charts, W1 and M1, still show a bullish channel that appears to be undergoing a correction.
It’s worth noting that November and December have historically been strong months for EURUSD. Based on daily data since 2000, here are some key statistics on EURUSD monthly returns:
■ November: +4.93% on average (7 bullish years ↑ and 6 bearish years ↓)
■ December: +20.7% on average (8 bullish years ↑ and 5 bearish years ↓)
Of course, these are just statistical trends and should not lead to hasty conclusions. Below is the TCI data table starting from October 18, including the forecast for the upcoming weeks.